From Data Chaos to Insight Engine
A Small Business Guide to Planning, Building, and Scaling an AI‑Ready Analytics Stack
Maira Koin
CEO, F Koin Tech
Published
20 August, 2026
Data is rarely the problem. The chaos around it is.
Most small and medium businesses are drowning in reports, spreadsheets, exports from SaaS Solutions, and screenshots of dashboards from different tools. Everyone has numbers, yet decisions are still made on gut feel, old habits, or whoever shouts loudest in the meeting.
This guide explains how to turn that data chaos into an AI‑ready analytics stack, step by step, in language that business leaders can use. You will see how to plan, build, and scale an insight engine that supports Artificial Intelligence, AI Automation, and real Digital Transformation, without pretending you are a big enterprise.
What an “AI‑ready analytics stack” actually means for a small business
AI‑ready does not mean you need a data science department or fancy Enterprise Software. It means your Business Technology is organised so that:
- Key data from your systems, like CRM, accounting, E‑commerce Solutions, and operations tools, can be combined reliably.
- Managers can see consistent numbers for revenue, pipeline, margin, and Customer Experience without hunting through ten different apps.
- AI for Business tools can safely summarise, classify, and recommend actions based on that data, instead of amplifying errors.
Think of your analytics stack as the “insight engine” that powers better pricing, cleaner operations, smarter marketing, and practical Business Automation. It should grow with you, not explode your budget.
Why fixing data chaos matters before you chase AI
Many businesses want predictive models, smart chatbots, and automated decision making. The uncomfortable truth is that Artificial Intelligence depends on boring basics: consistent data, clear definitions, and repeatable processes.
If your reports all show different numbers for “monthly revenue,” any AI Automation on top of that will be confusing, not helpful.
Sorting out your analytics stack first gives you:
- Faster decisions, because leaders see the same numbers and can trust them.
- Higher Business Productivity, because teams stop manually merging spreadsheets and chasing missing data.
- Better Customer Experience, because you can spot bottlenecks and fix them instead of guessing.
- A safe path into AI for Business, with data and workflows that AI can actually use.
Step 1: Decide what decisions your analytics stack should support
Most analytics projects fail because they start with tools, not decisions. Before you think about Data Analytics platforms, Cloud Solutions, or Custom Software Development, answer a simpler question.
List 5 to 10 decisions you want to improve
Good candidates are recurring decisions that move money, such as:
- Which marketing channels deserve more or less budget next month.
- Which leads sales should call first each morning.
- Which customers are at risk of churning in the next quarter.
- Which products or services are most profitable after all costs.
- Where operations are slowing down orders, projects, or tickets.
Write them in plain language, then add:
- Who makes this decision today.
- How often they make it.
- What data they currently use, if any.
These decisions define the “job” of your analytics stack. Everything you build later, from dashboards to workflow alerts to AI‑driven suggestions, should support these decisions first.
Step 2: Audit where your key data actually lives
With decisions listed, the next move is to see what data you already have. No fancy tools required, just a structured inventory.
Create a simple data inventory
Open a spreadsheet and create columns like:
- System or source (for example, CRM, accounting, E‑commerce platform, support tool, marketing automation, Google Sheets).
- Main purpose (customers, invoices, campaigns, tickets, inventory).
- Owner (team or person).
- Key data fields (customer ID, email, product, amount, dates, status).
- How you access data today (export, built‑in report, API, manual copy‑paste).
Include Cloud Solutions, internal databases, and any spreadsheets that people rely on weekly. If someone says “It is just my little sheet,” that probably means it is critical.
Map data to your priority decisions
For each decision from Step 1, ask:
- Which systems hold pieces of the puzzle.
- Where data is duplicated or inconsistent.
- Which fields are missing or unreliable.
For example, to decide “Which customers are at risk of leaving,” you might realise that:
- Usage data lives in your product or E‑commerce Solutions.
- Billing information sits in accounting.
- Complaints sit in your support system.
- Notes about frustration are trapped in sales or success emails.
Now you can see why nobody has a clean churn report. Your analytics stack will need to connect those dots in a structured way.
Step 3: Design a simple, layered analytics architecture
You do not need a technical blueprint to have a useful mental model. A small business analytics stack is easier to manage if you think in three layers.
Layer 1: Systems of record
These are your core business systems that own master data, for example:
- CRM or sales tool for leads and customers.
- Accounting or finance system for invoices and payments.
- E‑commerce platform for orders and products.
- Project or ticketing tool for delivery and support.
Your goal is to agree which system is the “source of truth” for each type of data, such as customer details or invoice status.
Layer 2: Data hub
This is where pieces of data come together for reporting and AI for Business. For a small business, the data hub might be:
- A modern analytics platform or BI tool with scheduled imports.
- A database in your Cloud Computing environment.
- In early stages, a set of well‑structured spreadsheets that behave like one source.
The key idea is that analysts and managers pull from this hub, not directly from every individual system. That is what turns chaos into a usable analytics stack.
Layer 3: Insight and action layer
On top of the data hub sits the part people see and use:
- Dashboards for leadership and team leads.
- Standard reports for finance, sales, operations, and marketing.
- Alerts, notifications, and Workflow Automation, for example “alert sales if a high‑value customer’s usage drops by 50 percent.”
- AI Automation and assistants that summarise, classify, or recommend next actions.
Your insight engine lives in this layer. The value is not only in graphs, but in how often real behaviour changes because of what people see.
Step 4: Standardise basic definitions so numbers match
If you have ever seen three different “monthly revenue” figures in three reports, you have already met the enemy: inconsistent definitions.
Agree a small set of core definitions
Gather key stakeholders from sales, finance, marketing, and operations. For each important metric, decide:
- How it is calculated, in plain language.
- Which system or data hub field it uses.
- Who owns the definition and can approve changes.
Core items usually include:
- Lead, marketing‑qualified lead, sales‑qualified lead.
- New customer vs existing customer.
- Gross revenue vs net revenue vs recurring revenue.
- Active customer, churned customer.
- Tickets or orders “in progress” vs “closed.”
Write these down in a short “data glossary.” Keep it simple, one or two sentences each. This small governance step does more for Business Efficiency than a lot of fancy tools.
Step 5: Choose tools that match your size and ambition
Once you know the decisions, data, and structure, you are ready to choose tools. Do not jump straight to the most famous Data Analytics stack or Enterprise Software.
Questions to ask before picking analytics tools
- What do we already own that we are under‑using, for example analytics in CRM, marketing, or E‑commerce Solutions.
- How many users really need advanced analysis vs simple dashboards.
- How often data needs to be updated for your decisions, hourly, daily, weekly.
- Who will maintain data flows and fix issues.
For many small businesses, a realistic starting mix might be:
- Use built‑in reports from existing SaaS Solutions for team‑level views.
- Add a mid‑market BI tool or analytics platform as your central data hub and reporting layer.
- Use Cloud Solutions for storage if you have very large or growing data sets.
- Keep Custom Software Development focused on connectors or specific dashboards that standard tools cannot handle.
A good Technology Consulting partner can help match tools to your stage and budget, instead of pushing you toward something designed for global enterprises.
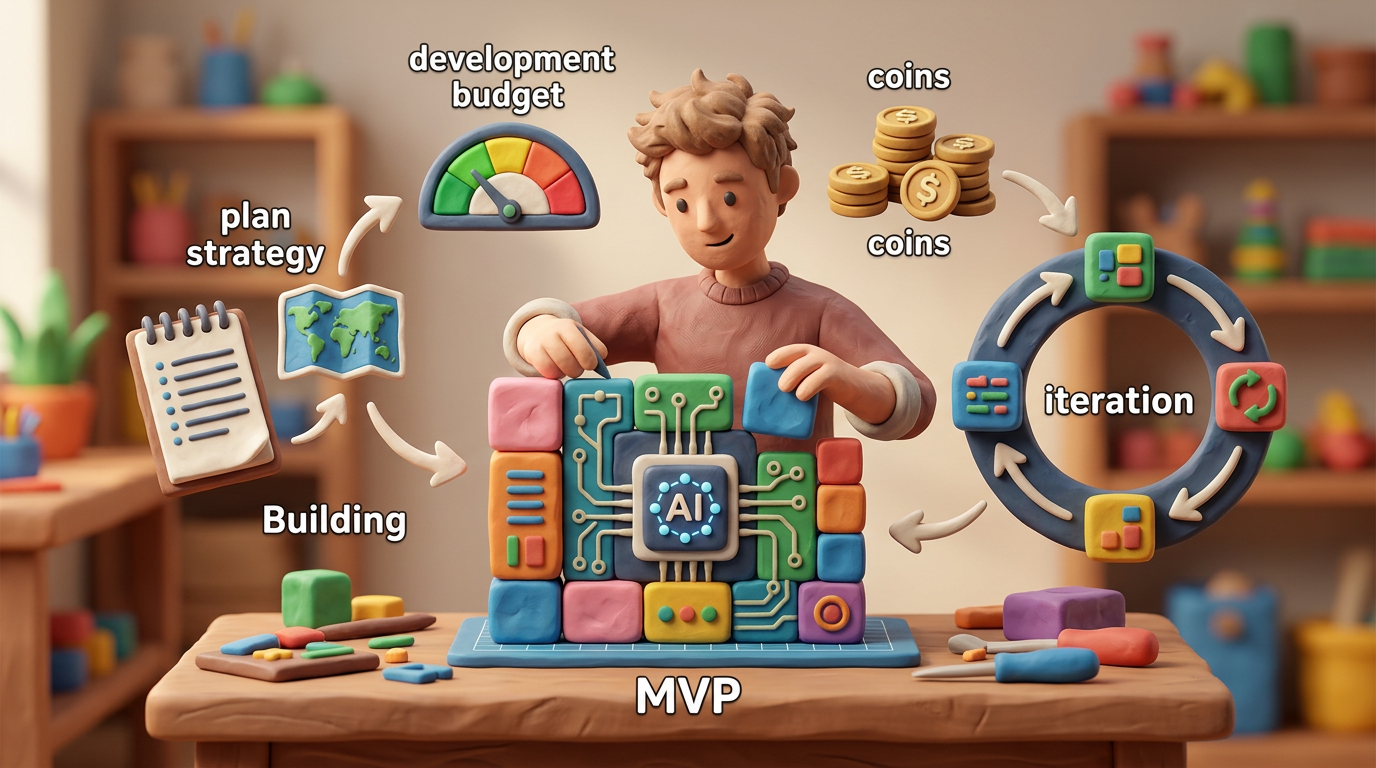
Step 6: Build an MVP analytics stack in 90 days
Trying to build the “final” analytics stack on the first attempt is a recipe for delays and disappointment. Treat the first version as a minimum viable analytics product, focused on a few critical decisions.
Month 1: Foundations and quick wins
- Confirm your list of priority decisions and data sources.
- Agree definitions for 10 to 20 core metrics.
- Connect 2 or 3 main systems to a basic data hub, even if that is just structured spreadsheets at first.
- Deliver a simple leadership dashboard with revenue, pipeline, and a couple of Customer Experience indicators.
The goal is not perfection, but a working insight engine that people actually use.
Month 2: Process‑level visibility
- Add more detailed data from operations or support, for example jobs, tickets, returns.
- Create dashboards for one core process, such as lead to cash, order to delivery, or ticket to resolution.
- Introduce basic Workflow Automation, such as alerts when SLAs are about to be missed.
- Start tracking time‑to‑value metrics, for example time from order to shipping, or from ticket opening to first response.
This is where Business Process Optimization kicks in. You will see bottlenecks you suspected, and some you did not.
Month 3: AI‑assisted analytics
- Add AI for Business helpers that summarise weekly performance by team or product line.
- Use classification models to tag leads, tickets, or customers by type or risk level.
- Test simple predictive indicators, such as “customers with usage drop plus a recent complaint are labeled at‑risk.”
- Refine dashboards based on real questions people are asking.
By the end of 90 days, you should have a usable analytics stack that supports decisions, not just pretty reports.
Where AI for Business fits in a small‑business analytics stack
AI is most valuable when it acts as an assistant inside your analytics process, not a mysterious black box making big decisions alone.
Practical AI use cases on top of your data hub
- Summaries and briefings. Automatically generate weekly performance summaries for sales, marketing, or operations based on dashboard data.
- Prioritisation. Score leads, tickets, or orders to help staff decide what to handle first.
- Classification. Tag interactions by topic, sentiment, or product, so you can see patterns without manual sorting.
- Forecast hints. Offer simple “based on current trends, you are likely to hit X” style insights that support human judgment.
These AI Automation use cases rely on reasonably clean, connected data, not perfection. Your stack does not have to be flawless, it has to be coherent.
Designing data for future, smarter AI
As you improve Business Technology, try to:
- Capture clear event data, such as quote sent, invoice paid, subscription renewed, ticket escalated.
- Track timestamps for key milestones in your processes.
- Mark outcomes with simple success or failure flags.
This pattern sets you up for more advanced AI for Business later, including churn prediction, demand forecasting, and automated anomaly detection.
Examples of AI‑ready analytics stacks in real businesses
Example 1: Service firm without a single source of truth
A 25‑person consulting company had:
- A CRM for deals.
- Project management software for delivery.
- Accounting software for invoices.
- Several spreadsheets for utilisation and margin calculations.
Leadership could not answer simple questions, like “Which clients are most profitable?” without a week of manual work.
The analytics overhaul focused on:
- Standardising client names and IDs across CRM, project, and accounting tools.
- Creating a modest Cloud Solutions data hub with joined tables for projects, hours, and invoices.
- Building a few clear dashboards: revenue by client, margin by project type, utilisation by consultant.
- Adding AI‑generated weekly summaries sent to team leads, highlighting margin dips or over‑allocated staff.
Within three months, they cut reporting time by roughly 60 percent and could confidently adjust pricing and staffing by client segment.
Example 2: E‑commerce retailer stuck in channel silos
An online retailer sold through its own site plus a marketplace. Data lived in:
- The E‑commerce platform for site orders and customer behaviour.
- The marketplace portal for external sales.
- Advertising dashboards for multiple ad platforms.
- The accounting system for actual payment and refunds.
Marketing decisions were based on last‑click reports and guesswork.
The new analytics stack:
- Consolidated orders from all channels into a central data hub.
- Linked ad spend to product and campaign performance.
- Created dashboards that showed true net margin by product after fees, shipping, and returns.
- Used AI for Business to suggest under‑performing products to review and potential cross‑sell opportunities.
This foundation also improved their Digital Strategy for search and content. They later invested in SEO‑friendly Web Development following guidance similar to How F-Koin Tech Can Help You Achieve a Higher Rank, now with clearer revenue data by keyword and page.
Common mistakes that keep analytics projects stuck
Mistake 1: Buying tools before defining questions
Many teams pick a shiny Data Analytics platform, then wonder what to track. The result is often a pile of unused dashboards.
Better: Start with a short list of decisions and metrics that matter for Startup Growth, then choose tools that can answer those cleanly.
Mistake 2: Letting every department build its own truth
Marketing has one dashboard, sales another, finance a third. None of the numbers match.
Better: Invest a few hours in shared definitions and a central data hub. Departments can still have their own views, but they pull from the same base.
Mistake 3: Treating analytics as a side project
If analytics is something IT or a single analyst does “when they have time,” it will always lag behind reality.
Better: Assign a business owner for the analytics stack, with clear goals tied to Business Efficiency, conversion, or Customer Experience.
Mistake 4: Aiming for perfection before showing anything
Trying to model every edge case before showing a single dashboard leads to long delays and frustrated stakeholders.
Better: Launch a rough but useful version for a few key processes, then iterate based on feedback.
Mistake 5: Jumping straight to advanced AI
Predictive models on top of noisy, incomplete data cause mistrust and rework.
Better: Start with AI helpers that summarise and classify data you already trust. Use their insights to guide future Digital Innovation.
Governance: light habits that keep your insight engine healthy
Data chaos often creeps back in unless you create simple rules. You do not need heavy committees, just a few habits.
Appoint a practical data owner
This person might be your operations lead, finance manager, or a digital lead. Their responsibilities:
- Maintain the list of core metrics and definitions.
- Approve new data sources added to the hub.
- Work with your Technology Consulting or Software Development partner on changes.
Run short analytics review sessions
Once a month, gather leaders for a 45‑minute review:
- Look at key dashboards and trends.
- Agree on 2 or 3 actions based on what you see.
- Note any data issues and assign owners to fix them.
This meeting turns your stack from a reporting engine into a Business Innovation engine.
Set simple rules for new tools and spreadsheets
To avoid new silos, agree that:
- Any new SaaS Solutions that hold important customer or financial data must be added to the data inventory.
- Spreadsheets that influence decisions get a clear owner and are either integrated into the data hub or retired over time.
- Custom Software Development projects include basic Data Analytics requirements from day one.
How to work with a technology partner on your analytics stack
Many businesses benefit from bringing in external support for their analytics strategy and implementation. Used well, a partner can cut months of trial and error.
What a good partner should help you with
- Clarifying which metrics matter most for your Digital Strategy and Startup Growth.
- Designing an analytics architecture that fits your current Business Technology and budget.
- Connecting existing systems, from SaaS Solutions to Enterprise Software, into a cohesive data hub.
- Building dashboards and AI for Business features that non‑technical staff can use.
- Creating simple governance so the stack keeps improving instead of drifting.
You stay the expert on your customers, pricing, and operations. They bring patterns from other companies, plus experience in Software Development, Web Development, Mobile App Development, and Cloud Computing.
12‑month roadmap to grow from data chaos to insight engine
Quarter 1: Clarity and core dashboards
- Define priority decisions and 10 to 20 key metrics.
- Complete your system and data inventory.
- Agree data definitions and choose a basic data hub and reporting tool.
- Launch first leadership dashboard with revenue, pipeline, and a few Customer Experience indicators.
Quarter 2: Process analytics and early automation
- Map one or two core processes, such as lead to cash or order to delivery.
- Connect required systems to the data hub, including CRM, E‑commerce Solutions, and support tools.
- Build process dashboards showing throughput, delays, and error points.
- Add simple Workflow Automation alerts triggered by data, such as overdue tasks or stalled deals.
Quarter 3: AI‑assisted insights and optimisation
- Introduce AI summaries and classification for sales, support, or operations data.
- Use Data Analytics to identify your most profitable segments or product lines.
- Run targeted Business Process Optimization in one area, for example reducing project delays or refund rates.
- Share short, AI‑generated performance briefings with managers each week.
Quarter 4: Scale, refine, and prepare for future trends
- Expand the analytics stack to cover more departments, while keeping definitions consistent.
- Retire redundant spreadsheets and duplicate reports.
- Review technology choices in light of Future Technology Trends, such as new AI capabilities in your existing SaaS Solutions.
- Set next‑year priorities for deeper AI for Business and Business Automation, backed by the data now at your fingertips.
Summary: build an insight engine your business can actually use
Turning data chaos into an AI‑ready analytics stack is less about tools and more about intention. Start from the decisions you want to improve. Map where your data lives. Design a simple architecture with systems of record, a central hub, and an insight layer that real people understand.
Standardise a small set of definitions, then ship a minimum viable analytics stack in a few months, not years. Add AI for Business carefully, beginning with summaries, classification, and prioritisation that save time and sharpen focus. Keep the whole effort grounded in Business Productivity, Customer Experience, and measurable results.
If you would like support auditing your current reports, planning an AI‑ready analytics roadmap, or connecting Software Solutions across Web Development, Mobile App Development, and Cloud Solutions, consider speaking with a technology partner that lives in Business Technology and Digital Strategy every day. A straightforward conversation can turn your scattered data into an insight engine that quietly pulls your business forward.