A Practical Guide to AI-Driven Data Analytics for Small Businesses
Turning Operations, Sales, and Customer Data into Actionable Insights
Maira Koin
CEO, F Koin Tech
Published
06 August, 2026
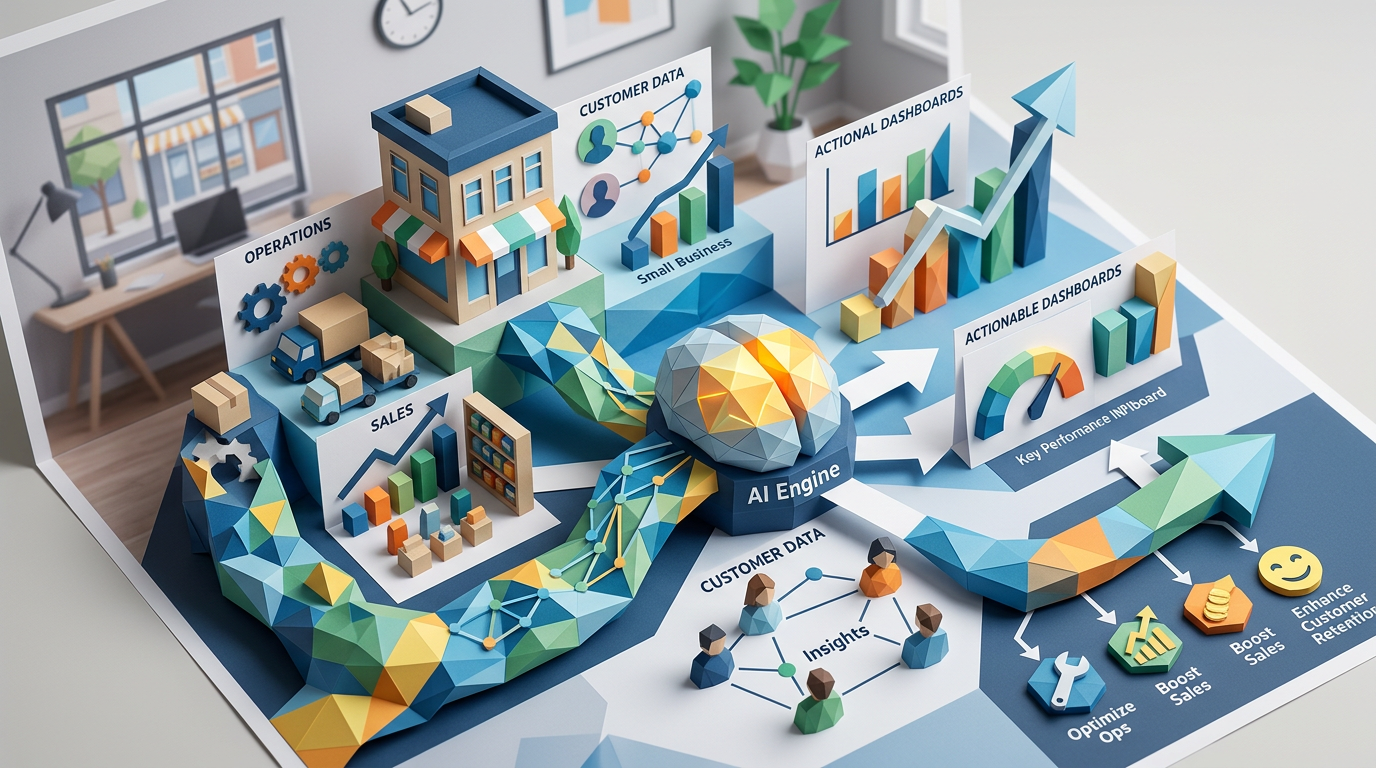
Most small businesses sit on more data than they realise. Orders in an E-commerce system, quotes in a CRM, invoices in accounting software, support emails, website analytics, even notes in shared spreadsheets. On their own, these pieces feel messy and incomplete. Used well with Artificial Intelligence and modern Data Analytics, they can guide decisions about pricing, staffing, marketing, product focus, and customer experience.
This practical guide explains how to use AI for Business to turn everyday operational, sales, and customer data into actionable insight. The aim is not to turn you into a data scientist. The aim is to help you design a simple Digital Strategy, use sensible Software Solutions, and get value from AI Automation without wasting time or money.
Why AI-driven data analytics matters for small businesses
Most leaders make dozens of decisions each week about stock, staffing, marketing spend, and priorities. Often these decisions rely on gut feel and a few ad hoc reports. AI-driven analytics gives you a more accurate, up to date picture, so those decisions become faster and less stressful.
Concrete benefits you can expect
Handled well, Artificial Intelligence applied to your data can help you:
- Spot patterns earlier such as rising demand for certain products, slipping response times, or higher churn in specific customer segments.
- Focus effort where it counts by highlighting profitable customers, high value deals, or high risk accounts that need attention.
- Improve Business Productivity as AI Automation prepares reports, summaries, and forecasts instead of staff wrestling spreadsheets each month.
- Strengthen Customer Experience with clearer understanding of what customers buy, how they behave, and where they struggle.
- Support Startup Growth by giving founders and managers a common view of performance rooted in facts, not opinions.
AI for Business is not magic. It works best when you have clear questions, consistent processes, and a realistic view of what your data can and cannot tell you.
Step 1: Start with decisions, not dashboards
Many analytics projects fail because they begin with tools. Teams sign up for a SaaS Solution, connect several systems, then stare at a dashboard that nobody uses. A better route is to start with decisions.
List 8 to 10 recurring decisions you make
Sit down with your leadership team and identify decisions you revisit every week or month, for example:
- Which products or services should we promote next month?
- Do we need to adjust staffing levels or shift patterns?
- Which marketing channels deserve more or less budget?
- Which customers should account managers prioritise this week?
- Which invoices or subscriptions present the highest risk of late payment or churn?
These decisions are the backbone of your Digital Strategy for data. AI and Data Analytics should make them easier, faster, and more accurate.
Turn each decision into a clear question
For each decision, write a specific question that analytics should answer, for example:
- “Which ten customers are most likely to reorder this month?”
- “Which three service types have the worst profit margins after delivery costs?”
- “Where are we losing leads in our sales process?”
Specific questions help you choose which Business Technology and AI tools you really need, and which data sources matter.
Step 2: Map your core data sources in plain language
AI-driven analytics does not mean collecting everything. It means knowing where key data lives and how reliable it is.
Identify your main systems of record
For most small businesses, information sits in a mix of:
- CRM or sales tools for leads, opportunities, and customer details.
- Accounting or finance software for invoices, payments, and expenses.
- E-commerce Solutions or order systems for products, baskets, and transactions.
- Support tools like helpdesks or shared inboxes for customer issues.
- Marketing platforms for email campaigns, website behaviour, and advertising performance.
- Spreadsheets that fill gaps between these Software Solutions.
Create a simple table with three columns: data type, current system, and main user. You do not need technical detail, just enough clarity to see where operational, sales, and customer data lives today.
Score each source for quality and completeness
Give each system a simple score from 1 to 5 on:
- Consistency are fields used the same way by everyone, or is it free text chaos?
- Coverage do key records exist, or are there gaps and duplicates?
- Freshness is the data up to date, or do people enter it late, if at all?
This quick assessment tells you where AI for Business will produce meaningful insights, and where you need a bit of Business Process Optimization or Workflow Automation first.
Step 3: Define a minimal analytics foundation
Before you touch Artificial Intelligence, you need a basic foundation so your numbers make sense. This is not a huge data warehouse project. Think of it as picking a small set of shared definitions.
Agree on a few key metrics
Different teams often use the same words but mean different things. Take time to agree definitions for metrics like:
- Lead when does a contact count as a lead, and where is it stored?
- Qualified opportunity what criteria must be met?
- Active customer how recent must a purchase or interaction be?
- Churned customer after how many months without activity?
Write these definitions down in simple language. They will sit behind your dashboards, AI models, and team conversations about performance.
Choose a primary analytics “home”
Pick one place where you will view and combine data, for example:
- Built in reporting from a strong CRM or Enterprise Software suite.
- A business intelligence SaaS Solution that connects to your main Cloud Solutions.
- A custom reporting portal created through Custom Software Development if your needs are unique.
The goal is a single, shared source of insight, even if the raw data still lives in several tools.
Step 4: Practical AI use cases for operations data
Operations data covers how work flows through your business: jobs, orders, projects, service delivery, and internal processes. AI-driven analytics can shine here because patterns tend to repeat and volumes are often reasonably high.
Use AI to spot bottlenecks and delays
An AI-enabled analytics tool can scan job or ticket history and highlight:
- Steps in a workflow where items sit idle for long periods.
- Teams or locations that regularly run behind schedule.
- Jobs that are likely to run over time based on early signals.
For example, a maintenance company might see that jobs involving certain parts often stall in the “waiting for materials” stage. That insight can drive Business Automation around stock alerts, or Business Innovation in how those jobs are scheduled.
Forecast workload and capacity
Using historical data, AI models can estimate how many orders, jobs, or support tickets you are likely to see in coming weeks. Even simple forecasts help with:
- Staffing plans and shift patterns.
- Stock and supply planning.
- Realistic delivery promises to customers.
You do not need perfect predictions. An early heads up that next month looks 20 percent busier than usual is already valuable.
Identify process improvement opportunities
AI-driven Data Analytics can group similar cases and surface where complexity or errors spike. You might find, for example, that:
- Projects over a certain value are much more likely to slip deadlines.
- Jobs involving new staff members take longer unless they pair with a senior colleague.
- Certain product combinations almost always lead to support calls later.
These patterns inform Business Process Optimization and staff training with real evidence instead of guesswork.
Step 5: Practical AI use cases for sales and revenue data
Sales and revenue analytics are among the most commercially valuable uses of AI for Business. They directly influence cash flow and growth plans.
Prioritise leads and accounts with AI scoring
AI models can score leads and accounts based on factors like activity level, company size, engagement history, and similarity to past buyers. The output might be as simple as:
- A daily list of leads “most likely to buy in the next 30 days”.
- Accounts with rising engagement that deserve a call this week.
- Deals at risk because activity has dropped compared with similar wins.
Your sales team still applies judgment, but they start each day with a shortlist instead of a giant spreadsheet.
Understand which offers actually drive profit
Many businesses track revenue, but profit by product or service is less clear. AI-enabled analytics can combine pricing, discounts, delivery costs, and support effort to estimate:
- True profit per product line or package.
- Customers who buy lots at heavy discount but generate little margin.
- Service types that look attractive but drain operational capacity.
These insights support pricing strategy, packaging decisions, and Business Innovation in how you design new offers.
Spot early signs of churn or missed upsell
By analysing purchase patterns and engagement, AI can flag:
- Customers whose order volume or product mix has slipped.
- Accounts that used to engage with campaigns but now ignore them.
- Segments that often upgrade after specific events.
Instead of reacting after customers leave, your team can reach out with relevant offers or support at the right time.
Step 6: Practical AI use cases for customer behaviour and feedback
Customer data is not just transactions. It also includes emails, chats, reviews, survey responses, website behaviour, and social comments. AI Automation is especially useful at turning this unstructured information into clear themes.
Turn conversations into structured insight
AI tools can read support tickets, chat logs, and email threads to:
- Group issues by topic, root cause, or product.
- Measure sentiment so you see where frustration is rising.
- Highlight recurring questions that your website or sales materials do not answer well.
For example, you might discover that 40 percent of support contacts relate to one unclear step in your onboarding. Fixing that with better content, or Workflow Automation in your portal, has a direct impact on Customer Experience.
Analyse reviews and survey responses at scale
Instead of reading every review, AI for Business can summarise:
- Top three reasons people praise your company.
- Top three reasons they criticise it.
- Differences in feedback between locations, product lines, or customer segments.
This helps you prioritise operational fixes, training, and Digital Innovation that align with what customers actually care about.
Connect behaviour to marketing decisions
Combined with website and campaign analytics, AI can show:
- Which content pieces tend to precede purchases.
- Which traffic sources bring high value customers, not just clicks.
- Which journeys often lead to abandoned baskets or dropped enquiries.
If you are building a broader online presence, resources like What is SEO? How it can help to grow? and Why digital marketing is important? pair well with this kind of analytics work, since they help you connect insight to specific marketing actions.
Step 7: Choose the right AI and analytics approach for your stage
Different businesses need different levels of sophistication. You do not have to jump straight to custom machine learning. Three broad paths cover most small and medium organisations.
Path 1: Built in analytics with light AI features
Many modern SaaS Solutions, from CRM to E-commerce platforms, already include:
- Standard dashboards for sales and operations.
- AI suggestions, for example best time to send emails or likely deal value.
- Basic forecasting based on historical data.
This is often the fastest path to value. Focus on configuring those Cloud Solutions properly, aligning fields with your agreed definitions, and training staff to use the insights.
Path 2: Centralised reporting with AI assisted insights
If your data sits across several tools, you may need a central reporting layer. This might be:
- A business intelligence platform that connects to multiple SaaS Solutions.
- A reporting module of your main Enterprise Software.
- A custom dashboard built through Software Development that pulls from your databases and APIs.
On top of this layer, you can add AI to summarise trends in plain language, propose focus areas, and alert you to anomalies.
Path 3: Custom AI models for critical decisions
For some businesses, specific decisions carry enough impact to justify Custom Software Development for AI models, for example:
- Credit or risk scoring in financial services.
- Complex pricing or routing decisions in logistics.
- Demand forecasting that drives large inventory or staffing commitments.
In these cases you would typically work with a Technology Consulting partner to design, train, and monitor models closely. This is a later stage for most small organisations, once simpler AI Automation and analytics have already delivered value.
Step 8: Introduce AI insights to your team in a way that sticks
Good analytics does not help if nobody uses it. Adoption is a people question as much as a technology one.
Start with regular, short review rituals
Pick a few recurring meetings and give them a data focus:
- A weekly sales stand up that starts with a simple AI generated summary of the pipeline.
- A monthly operations review based on cycle times, bottlenecks, and customer wait times.
- A quarterly strategy session informed by profit by segment, churn patterns, and marketing performance.
Keep reports short. One slide or dashboard per topic is often enough. Encourage people to ask “why” and “what should we change” instead of debating the numbers themselves.
Explain AI outputs in plain language
If staff do not understand how AI arrived at its suggestions, they will either ignore them or trust them blindly. Neither is helpful. For each AI feature, make sure people know:
- What data it uses.
- What it is optimising for, such as likelihood to buy or risk of delay.
- How confident it tends to be, in rough terms.
Encourage healthy challenge. For example, ask sales reps where lead scores feel off and feed that feedback back into your configuration or models.
Step 9: Set up simple governance and guardrails
As you rely more on AI-driven Data Analytics, you need basic guardrails so outputs stay reliable and fair.
Define which decisions AI can influence, not own
For each use case, label AI as:
- Assist AI provides summaries or suggestions that humans always review.
- Recommend AI suggests a decision and can act automatically for low risk cases, with override options.
- Automate AI or rules make the decision outright for very simple, low impact tasks.
For small business contexts, it is usually wise to keep AI in assist and recommend modes for anything that affects customers, staff pay, compliance, or large financial commitments.
Document basic data responsibilities
You do not need a thick policy manual, but you should answer questions such as:
- Which systems are official sources of truth for each data type.
- Who owns data quality for customers, products, and financials.
- Which external vendors process your data, for analytics or AI.
- How you respond to customer requests about their data.
Clear answers build internal discipline and external trust, and they support any privacy or regulatory obligations you face.
Step 10: Plan a 12 month roadmap for AI-driven analytics
Trying to do all of this at once is a recipe for frustration. A focused 12 month roadmap is usually enough to build a solid AI analytics capability.
Quarter 1: Clarify decisions and stabilise data
- List recurring decisions and turn them into concrete questions.
- Map main data sources and score them for quality.
- Agree core metric definitions across sales, operations, and finance.
- Choose a primary analytics home, even if simple.
Quarter 2: Connect key systems and launch first AI use cases
- Connect CRM, finance, and order systems into your analytics layer.
- Configure basic dashboards for sales, operations, and Customer Experience.
- Introduce one or two AI assistants, such as lead scoring or simple workload forecasts.
- Start weekly or monthly review rituals based on these insights.
Quarter 3: Extend to customer behaviour and process analytics
- Bring in customer support, website, and marketing data.
- Use AI to summarise conversations and feedback into themes.
- Analyse process performance to identify bottlenecks and rework.
- Link insights to Business Process Optimization projects and Workflow Automation ideas.
Quarter 4: Standardise, automate, and refine
- Formalise a light governance checklist for new AI and analytics initiatives.
- Automate recurring reports and alerts so managers spend less time compiling data.
- Review which AI features drive real decisions and refine or retire weak ones.
- Plan next year’s priorities, for example deeper forecasting or custom AI models for high impact decisions.
Common mistakes small businesses make with AI-driven analytics
Mistake 1: Jumping into complex AI before fixing basic data hygiene
If your CRM is half empty, product codes are inconsistent, or invoices are routinely backdated, complex AI models will produce unreliable results.
Better: Spend a few weeks improving data entry habits, required fields, and simple Workflow Automation around key processes. AI will then have something solid to work with.
Mistake 2: Treating dashboards as the goal, not a means
Pretty charts are easy to admire once, then ignore. The real point is better decisions and outcomes.
Better: Tie each dashboard or AI feature to a specific decision or action. If nobody can say what they will do differently based on a chart, remove or redesign it.
Mistake 3: Over trusting AI scores and forecasts
Early models are often wrong at least some of the time. Blind trust in lead scores or churn predictions can misdirect effort.
Better: Treat AI as an adviser that needs monitoring. Compare predictions with actual outcomes for a few months and adjust thresholds or rules accordingly.
Mistake 4: Ignoring the human side of data use
Staff may feel judged or micromanaged if performance metrics suddenly appear without context.
Better: Explain why you are investing in AI-driven analytics, emphasise support rather than surveillance, and involve teams in choosing what to measure and how to act.
Mistake 5: Trying to build everything in house without support
Analytics and AI projects can quietly consume a lot of time if nobody involved has design or data experience.
Better: Use a mix of strong SaaS Solutions and targeted Technology Consulting. Keep your internal focus on business questions, data ownership, and adoption, while specialists handle technical integration and Custom Software Development where necessary.
FAQs about AI-driven data analytics for small businesses
Do we have enough data as a small business to benefit from AI?
Usually, yes. AI for Business is not only about huge datasets. Many valuable uses rely on pattern recognition and summarisation across the information you already have, such as CRM records, orders, and support tickets. The key is consistency and clarity, not volume alone.
How expensive is it to start with AI-driven analytics?
Costs vary, but most small companies can begin using analytics and AI features already included in their existing SaaS Solutions and Cloud Solutions. The main investment is usually time to align definitions, tidy data, and train staff. Custom AI development is a later step once simpler gains have been realised.
Do we need a dedicated data or analytics team?
Not at the start. You need a data owner, typically a senior manager who cares about performance and is willing to champion better use of Business Technology. External Technology Consulting support or a Software Development partner can provide technical skills for integration and AI work as needed.
How long until we see value from AI analytics?
For focused use cases like lead scoring or basic forecasting, you can usually see early benefits within 8 to 12 weeks, including setup and initial tuning. Deeper gains in Business Efficiency and Customer Experience build over several months as teams adjust habits and processes based on insights.
Is AI-driven analytics only useful for online or E-commerce businesses?
No. Any organisation that records orders, projects, appointments, or jobs in digital tools can apply AI-driven analytics. Service firms, manufacturers, trades, and professional practices all benefit from clearer visibility into workload, profitability, and customer behaviour.
Summary: Treat AI analytics as a practical management tool, not a science project
AI-driven Data Analytics is no longer reserved for large enterprises with complex Enterprise Software. Small and medium businesses can use Artificial Intelligence to interpret everyday operational, sales, and customer data in ways that improve Business Productivity, Business Efficiency, and Customer Experience.
The most effective approach is simple and disciplined. Start from the decisions you already make, stabilise basic data, choose sensible Software Solutions, then introduce AI where it directly supports action. Review results regularly, keep humans in control of sensitive decisions, and treat analytics as part of your ongoing Digital Transformation rather than a one off initiative.
If you are considering how to use AI and analytics more effectively, but are unsure where to start, it can help to talk with an experienced partner in Software Development, Web Development, Mobile App Development, and Business Automation. A short, focused conversation about your data, systems, and goals can lead to a practical roadmap that fits your budget and turns scattered information into a steady guide for smarter growth.