AI KPI Dashboard Guide
A practical guide for small businesses on using AI-powered KPI scorecards to turn web, mobile, and SaaS metrics into a clear executive dashboard that speeds up decision‑making.
Maira Koin
CEO, F Koin Tech
Published
13 July, 2026
Struggling to Measure the Real Impact of AI?
You’ve invested in AI tools, automations, and pilots. But when someone asks, “Is this actually working?” it’s hard to give a clear, confident answer.
Data is scattered across tools, reports are manual, and every team tracks something different. Without a simple way to see what’s happening, it’s impossible to prove ROI, spot issues early, or decide what to improve next.
An AI KPI dashboard solves this by turning messy data into clear, actionable insight.
What Is an AI KPI Dashboard?
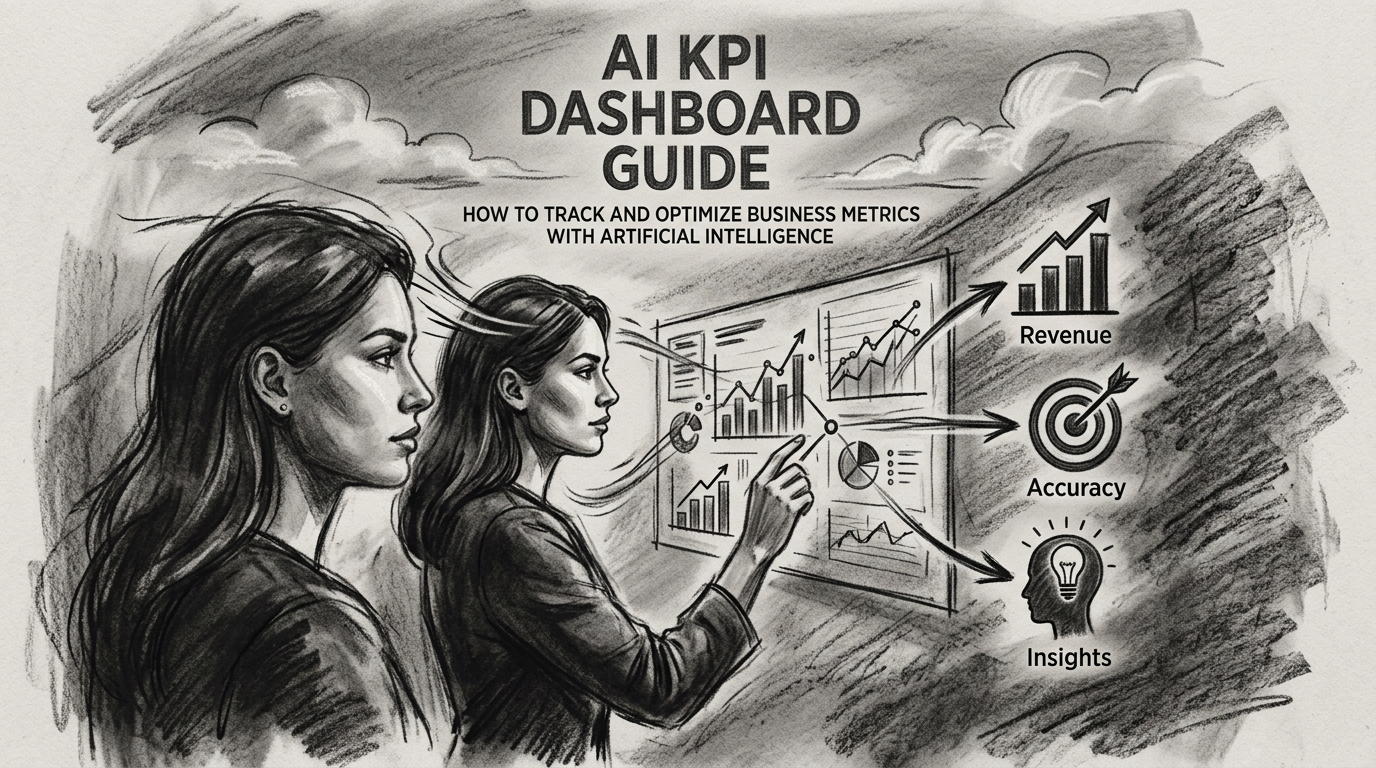
An AI KPI dashboard is a single, visual view of the metrics that matter most to your AI projects and automations.
Instead of digging through spreadsheets or separate apps, you get a live snapshot of performance in one place. It shows how AI is impacting your business, in real time.
Why It Matters
- Clarity: Everyone sees the same numbers, updated automatically.
- Speed: No more manual reports or guessing what’s going on.
- Focus: You track what actually matters, not every possible metric.
Key KPIs to Track on Your AI Dashboard
The best AI dashboards are simple and aligned with business goals. Start with a small, clear set of KPIs.
1. Adoption & Usage
- Active users: How many people use your AI tools regularly?
- Sessions or prompts: How often are they used per day or week?
- Feature usage: Which AI features are used most or least?
These metrics show whether your AI initiatives are actually being used in the real world.
2. Efficiency & Time Saved
- Time per task: How long does a task take before vs. after AI?
- Tasks automated: Number or percentage handled fully by AI.
- Cost per task: How much you spend per output with and without AI.
This is where you start to see productivity gains and cost savings.
3. Quality & Accuracy
- Error rate: How often AI outputs need correction.
- Approval rate: How many AI results are accepted on first pass.
- Human review time: How long it takes to check and edit AI work.
These KPIs help you understand if AI is reliable enough for your workflows.
4. Business Impact & ROI
- Revenue influenced: Deals, upsells, or leads touched by AI.
- Cost savings: Hours saved, headcount avoided, or reduced spend.
- Conversion lift: Impact on sign-ups, purchases, or support resolution.
These metrics connect your AI efforts to real business outcomes.
How to Design an Effective AI KPI Dashboard
You don’t need a complex setup to start. Focus on clarity, not perfection.
1. Start With One Goal
Decide the main question your dashboard should answer, such as:
- “Is our AI support chatbot reducing response time?”
- “Is AI helping our team produce more content per week?”
- “Are we getting a positive ROI from our AI pilot?”
Design your KPIs around this primary goal before adding anything else.
2. Keep the Layout Simple
- Put the most important KPI at the top.
- Group related metrics together (usage, quality, ROI).
- Use clear labels and plain language, not technical jargon.
3. Choose the Right Tools
You can build an AI KPI dashboard with tools you may already have, like:
- BI platforms (e.g., Looker Studio, Power BI, Tableau)
- Spreadsheet dashboards (Google Sheets, Excel with charts)
- Product analytics tools and custom internal dashboards
The “best” tool is the one your team will actually use and update.
4. Automate Data Where Possible
Manually updating charts quickly becomes a bottleneck. Whenever you can, connect data sources directly:
- Pull usage metrics from your AI platform or logs.
- Sync business data from CRM, helpdesk, or analytics tools.
- Schedule updates so numbers refresh automatically.
Best Practices for Using Your AI KPI Dashboard
A dashboard only creates value when people look at it and act on it.
Review Regularly
- Set a weekly or bi-weekly review meeting.
- Highlight wins, risks, and trends instead of raw numbers.
- Decide one or two actions after each review.
Share Across Teams
AI touches many parts of the business. Make your dashboard visible to:
- Leaders who care about strategy and ROI.
- Operators who manage workflows and processes.
- Technical teams who maintain models and integrations.
Iterate as You Learn
Your first version will not be perfect. That’s normal.
- Remove metrics nobody looks at.
- Add new KPIs as your AI use cases mature.
- Refine definitions so everyone understands each metric.
Turn AI Data Into Decisions
An AI KPI dashboard gives you more than numbers. It gives you a shared view of reality so you can decide what to scale, what to fix, and what to stop.
Start small, track a handful of meaningful KPIs, and build from there. With the right dashboard in place, you can finally show how AI is helping your business work smarter, faster, and more efficiently.